
Introduction
Here is a truth most WordPress site owners do not want to hear: your site might feel fast when you load it from your office in Islamabad or New York — and still be silently failing Google’s Core Web Vitals assessment for 75% of real-world users.
In 2024, Google completed its full transition to page experience as a ranking signal. In 2025, it replaced the old FID (First Input Delay) metric with the far more demanding INP (Interaction to Next Paint). As we move through 2026, the bar has risen again: Google no longer simply asks “is your site fast?” — it asks “is the entire journey seamless?”
The problem is that most WordPress sites fail Core Web Vitals not because of slow hosting, but because of invisible issues: a hero image loading without a preload hint, a page layout that shifts 0.15 units after a font loads, or a checkout button that takes 280ms to respond after a click. These are fixable problems. And fixing them does not just improve your rankings — it improves the experience for every single visitor.
This guide provides the complete, step-by-step framework to diagnose and fix LCP, INP, and CLS on your WordPress site. We will cover hosting bottlenecks, plugin bloat, image optimisation, JavaScript execution, and the specific plugin stack that consistently delivers the best results in 2026. Whether you scored 42 on PageSpeed Insights or 78, there is a concrete fix here for you.
| 🎯 Who This Guide Is ForThis guide is written for WordPress site owners, developers, and SEO professionals who want to diagnose and resolve Core Web Vitals failures themselves. Basic familiarity with WordPress admin and caching plugins is assumed. No coding expertise is required for most fixes. |
Understanding the 2026 Core Web Vitals Metrics
LCP, CLS, and the Rise of INP (Interaction to Next Paint)
Before you can fix Core Web Vitals, you need to understand precisely what you are measuring — and why each metric exists. Google’s three CWV signals each target a distinct dimension of the user experience.
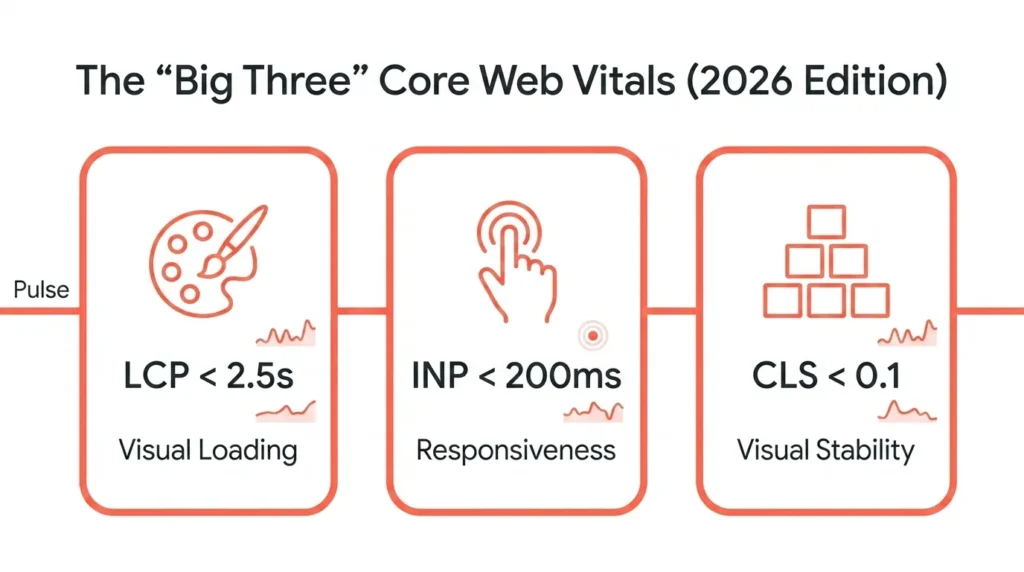
LCP — Largest Contentful Paint measures how quickly the most prominent visual element on a page loads. This is typically your hero image, a large headline, or a featured video thumbnail. Google’s threshold is clear: LCP must occur within 2.5 seconds of the page beginning to load. Between 2.5s and 4.0s is classified as ‘Needs Improvement.’ Above 4.0s is ‘Poor.’ A poor LCP score means visitors are staring at a partially loaded page while your competitors’ sites are already interactive.
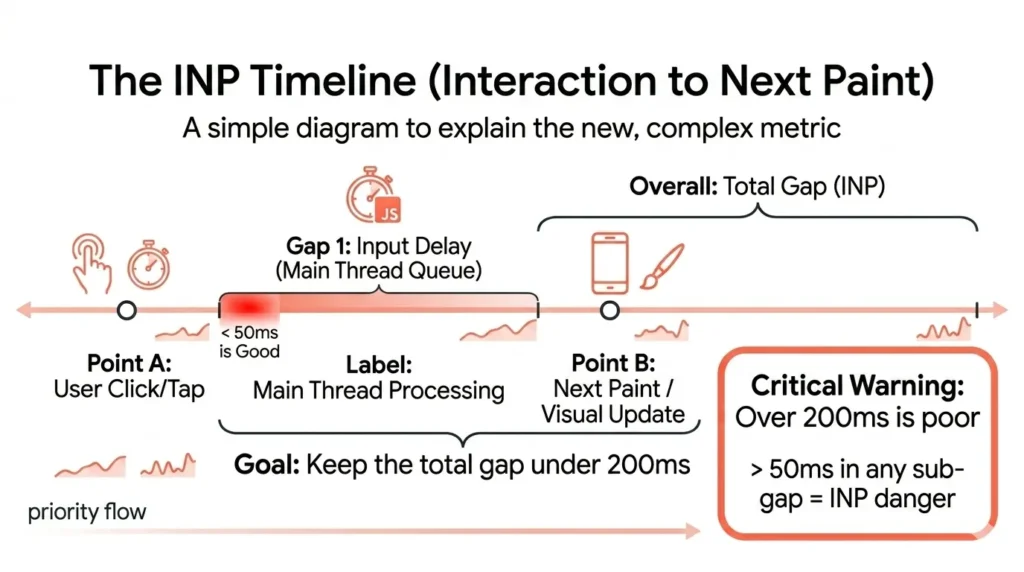
INP — Interaction to Next Paint is the most significant change to Core Web Vitals in the past two years. It replaced FID (First Input Delay) in March 2024 and is considerably harder to pass. Where FID only measured the delay before the browser began processing the first interaction, INP measures the full visual response time of every interaction on the page — taps, clicks, keyboard inputs. The target is 200ms or less. Above 500ms is ‘Poor.’ For most WordPress sites with heavy plugins, this is the hardest metric to optimise.
CLS — Cumulative Layout Shift measures visual stability. It quantifies how much page content moves unexpectedly while a user is reading or interacting. The target is a CLS score of 0.1 or less. Above 0.25 is ‘Poor.’ The most common causes on WordPress sites are images without declared dimensions, embedded content, and web fonts loading after initial render.
| ≤ 2.5sLCP Target | ≤ 200msINP Target | ≤ 0.1CLS Target | 75%Of visits must pass |
| 🔬 Lab Data vs. Field Data: A Critical DistinctionPageSpeed Insights and Lighthouse show you ‘lab data’ — a simulation run in controlled conditions. But what actually affects your Google rankings is ‘field data’ from the Chrome User Experience Report (CrUX), which reflects the real experiences of real visitors over the past 28 days. A site can score 90 in Lighthouse and still fail Core Web Vitals in Google Search Console. Always check the CrUX data in GSC’s ‘Page Experience’ report, not just your Lighthouse score. |
One more crucial nuance: Google’s assessment is based on the 75th percentile of your visitors’ experiences. This means 75% of all page visits must meet the ‘Good’ thresholds for a page to pass. If even 26% of your visitors experience a 3.5s LCP, the entire page fails — regardless of how fast it loads for the other 74%.
The Foundation — Hosting and Server-Level Fixes
Why Your WordPress Hosting Is Your LCP Bottleneck
Here is the uncomfortable truth about WordPress performance: if your server response time (TTFB — Time to First Byte) is poor, no front-end plugin can save you. You can install WP Rocket, compress every image, and defer every script, but if the server is taking 1.2 seconds to start sending data, your LCP will never reach ‘Good.’
TTFB (Time to First Byte) is the elapsed time between a browser requesting your page and the first byte of data arriving. Google’s threshold for ‘Good’ TTFB is 800ms or less, but top-tier managed WordPress hosts routinely achieve TTFB below 200ms. If your TTFB exceeds 600ms, address hosting before everything else. Switching to a managed host with built-in server-level caching is often the single highest-impact change a WordPress site can make for Core Web Vitals.
Server Configuration Checklist
• PHP version: Upgrade to PHP 8.2 or 8.3. Studies show PHP 8.2 processes requests 30-40% faster than PHP 7.4, which is still running on a significant portion of WordPress sites. Check your version in cPanel or your host’s dashboard.
• HTTP/3 support: Modern browsers negotiate HTTP/3 (QUIC protocol) with compatible servers, reducing connection overhead and improving performance on mobile networks. Confirm your host supports it.
• Object caching: Implement Redis or Memcached to store frequently-used database query results in memory. Without object caching, every page load triggers fresh database queries — on a busy WordPress site, this alone can add 200-400ms of server response time.
• PHP OPcache: Ensure OPcache is enabled on your server. It caches compiled PHP bytecode, eliminating the need to recompile scripts on every request. Most quality hosts enable this by default; verify with your provider.
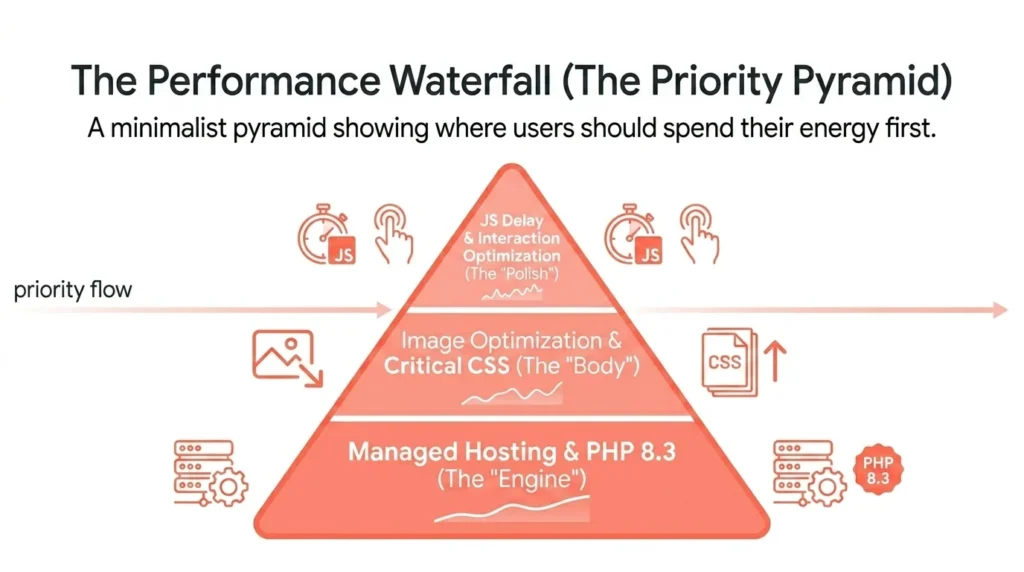
| ⚡ Hosting Benchmark Reality CheckIndependent testing by performance specialists has found that top-tier managed WordPress hosts — such as Kinsta, WP Engine, and Cloudways — achieve median TTFB values of 170-250ms. Budget shared hosting on the same tests often shows TTFB of 900ms to 1.8 seconds. If you are on budget shared hosting and struggling with Core Web Vitals, a hosting upgrade will deliver more improvement than any plugin combination. |
Solving the LCP Puzzle
Optimising WordPress Images and Render-Blocking Resources
Once server response time is under control, the LCP battle moves to the front end. For the vast majority of WordPress sites, the LCP element is a hero image — the large banner or featured image at the top of the page. How that image is requested, formatted, and delivered has an enormous impact on your LCP score.
Image Formats: Moving Beyond WebP to AVIF
WebP was the recommended next-generation format for years, and for good reason — it delivers roughly 25-35% smaller file sizes than JPEG at equivalent quality. However, AVIF (AV1 Image Format) is now supported by all major browsers and offers an additional 20-50% size reduction over WebP for photographic images. For a 400KB hero JPEG, converting to WebP might yield 270KB, while AVIF can bring it down to 150KB. That difference directly reduces your LCP time.
Plugins such as ShortPixel, Imagify, and Optimole support AVIF conversion and serve the appropriate format based on browser support. Enable AVIF as the preferred format with WebP as a fallback for older browsers.
The Critical Mistake: Lazy-Loading Your LCP Element
This is one of the most common and damaging Core Web Vitals errors on WordPress sites. Lazy loading is an excellent technique for images below the fold — it defers loading until the user scrolls down, saving bandwidth. But if your hero image has loading=”lazy” applied to it, the browser will not start downloading it until it determines it is visible — which is too late. The LCP image must begin loading immediately, before any other resource.
The correct approach is to add fetchpriority=”high” to your LCP image element and a preload link in the document head. This tells the browser to request this image at the highest possible priority, before CSS and JavaScript processing is complete.
| 💡 Implementation TipIn WordPress, your theme likely outputs the hero image dynamically. Most modern caching plugins (WP Rocket, NitroPack) include an option to automatically detect and preload the LCP element. Enable this setting first. If you need manual control, add `<link rel=”preload” as=”image” href=”your-hero.avif”>` to your theme’s header.php, or use a plugin like Perfmatters to add custom code to the document head. |
CSS: Inline Critical, Defer the Rest
Render-blocking CSS is a significant LCP killer. When a browser encounters a stylesheet link in the document head, it pauses page rendering until the entire CSS file downloads and parses. For a WordPress theme with a 180KB stylesheet, this can easily cost 400-800ms of LCP time.
The solution is critical CSS extraction: identify the CSS rules that style above-the-fold content, inline that subset directly in the HTML document, and defer the full stylesheet to load asynchronously after the page is visible. Tools like WP Rocket’s ‘Remove Unused CSS’ and NitroPack handle this automatically. If you want granular control, Perfmatters allows you to define exactly which scripts and styles load on each page type.
LCP Optimisation Action List:
1. Convert all images to AVIF format (with WebP fallback). Use ShortPixel, Imagify, or Optimole.
2. Remove lazy loading from your hero/LCP image. Add fetchpriority=”high” and a <link rel=”preload”> in the document head.
3. Enable critical CSS extraction in your caching plugin. Defer non-critical stylesheets.
4. Deploy a CDN with edge caching. Cloudflare (free tier), BunnyCDN, or your host’s built-in CDN will serve assets from locations closer to each visitor.
5. Eliminate render-blocking JavaScript by deferring or async-loading non-essential scripts.
Fixing CLS — Visual Stability
Eliminating Layout Shifts for a Flawless User Experience
Of the three Core Web Vitals metrics, CLS is the one that most directly correlates with user frustration. We have all experienced it: you begin reading an article, reach out to tap a link — and the page jumps, and you tap the wrong element. That is a layout shift in action. A CLS score above 0.25 is classified as ‘Poor’ and is a strong negative ranking signal.
The Three Most Common CLS Culprits on WordPress Sites
1. Images and media without explicit dimensions
When a browser encounters an <img> tag without width and height attributes, it does not know how much space to reserve for the image until it downloads. When the image loads, everything below it shifts downward. The fix is straightforward: always declare explicit dimensions on every image. In WordPress, the block editor preserves image dimensions automatically, but custom HTML in themes and legacy content often does not.
2. Web fonts and font-display behaviour
When a page loads with a custom web font (Google Fonts, Adobe Typekit, or self-hosted fonts), the browser initially renders text in a system font, then swaps it once the custom font downloads. This font swap causes text to reflow and contributes to CLS. The fix is to set font-display: swap in your CSS @font-face declarations and to self-host critical fonts rather than loading them from external servers. Self-hosting eliminates an extra DNS lookup and gives you full control over caching headers.
3. Dynamically injected content and advertisement slots
Ads, cookie consent banners, sticky headers, and content injected by third-party scripts are some of the most persistent sources of high CLS. If an advertisement loads above existing content and is not pre-allocated space, the resulting shift can push your CLS to 0.4 or above. The solution is to always reserve space for dynamic content in CSS before it loads. Use min-height on ad container elements and position cookie banners in a fixed position that does not affect document flow.
Using Chrome DevTools to Find Layout Shifts
Open Chrome DevTools (F12), go to the Performance panel, and record a page load. In the filmstrip at the top, look for frames where the layout shift score spikes. Click on any ‘Layout Shift’ event in the timeline — DevTools will highlight the Layout Shift Region in blue directly on the page, showing you the exact element that moved. Once you know which element is shifting, tracing it to the root cause (missing dimension, dynamic injection, font swap) becomes straightforward.
| 🛠️ Quick CLS Diagnostic with Chrome DevTools1. Open your site in Chrome. Press F12. Go to the ‘Performance’ tab. 2. Click ‘Record’, reload the page, then stop recording. 3. In the timeline, filter by ‘Layout Shift’ events (look for orange markers). 4. Click any shift event to see the ‘Layout Shift’ region highlighted on the page. 5. Check the ‘Sources’ section to identify which element triggered the shift. |
Master the New Metric — Optimising INP
How to Improve WordPress Responsiveness and Interaction Speed
INP is the Core Web Vitals metric that most WordPress site owners have not yet addressed — and it is increasingly the one that is causing sites to fail. Unlike LCP, which is largely a loading speed question, INP is about what happens after the page loads. It measures how quickly the browser visually responds to user interactions: clicking a button, opening a mobile menu, submitting a form.
The primary cause of poor INP on WordPress sites is main thread contention — a situation where the browser’s main thread is so busy executing JavaScript that it cannot respond to user interactions quickly. When a user clicks a button while a 200ms JavaScript task is executing, the browser queues the interaction and only responds after the task completes. If multiple long tasks are running, the delay compounds.
The 50ms Rule: Breaking Up Long JavaScript Tasks
Google defines a ‘long task’ as any JavaScript execution that blocks the main thread for more than 50 milliseconds. Research consistently shows that reducing the number and duration of long tasks is the most effective strategy for improving INP. The target is to ensure that no single JavaScript task exceeds 50ms during page interaction.
On WordPress sites, the most common sources of long tasks are heavy page builder scripts (Elementor, Divi, WPBakery), unoptimised WooCommerce cart logic, bloated theme JavaScript, and poorly implemented third-party scripts. The first diagnostic step is identifying which scripts are causing long tasks in your specific configuration.
Diagnosing Plugin-Caused INP with Query Monitor
Install the free Query Monitor plugin. It provides a performance panel in your WordPress admin bar showing script load times, database query counts, and PHP execution bottlenecks. For JavaScript-specific profiling, use Chrome DevTools’ Performance panel: record an interaction, then examine the ‘Main’ thread in the flame chart to identify long tasks and the scripts responsible.
Deferring Third-Party Scripts Until After Interaction
Third-party scripts — Google Analytics, Facebook Pixel, live chat widgets, heatmap tools — are among the most common causes of poor INP. Many of these scripts add event listeners and polling intervals that continuously compete for main thread time, even when the user is not actively interacting with their functionality.
The 2026 best practice is interaction-based loading: delay third-party script initialisation until after the user’s first interaction (scroll, mouse move, or click). Both WP Rocket and Perfmatters offer this as a built-in option called ‘Delay JavaScript Execution.’ Enabling this for analytics scripts, chat widgets, and social pixels consistently yields INP reductions of 100-200ms on JavaScript-heavy WordPress sites.
INP Optimisation Checklist:
• Use Chrome DevTools Performance panel to identify long tasks (> 50ms) on your pages.
• Install Query Monitor to identify PHP-side bottlenecks that extend server response.
• Enable ‘Delay JavaScript Execution’ in WP Rocket or Perfmatters for all non-essential third-party scripts.
• Audit installed plugins — disable plugins one at a time on a staging site and re-test INP after each. This identifies the specific plugin causing main thread congestion.
• If using Elementor: update to the latest version (recent releases include significant INP improvements) and enable Elementor’s built-in asset optimisation settings.
• Consider replacing jQuery-dependent plugins with lightweight alternatives. jQuery itself adds significant script parse time on slower devices.
| 📊 Key Statistic: The 50ms ThresholdAccording to Google’s Web Vitals research, reducing long-running JavaScript tasks below 50ms is the single most impactful action for improving INP. In their analysis, sites that eliminated all tasks above 50ms during typical user interactions moved from ‘Needs Improvement’ to ‘Good’ INP in 68% of cases. The culprit on most WordPress sites is not a single large script but an accumulation of moderate-sized scripts all executing simultaneously on page load. |
The 2026 WordPress Speed Stack
Top Plugins and Tools for Core Web Vitals Success
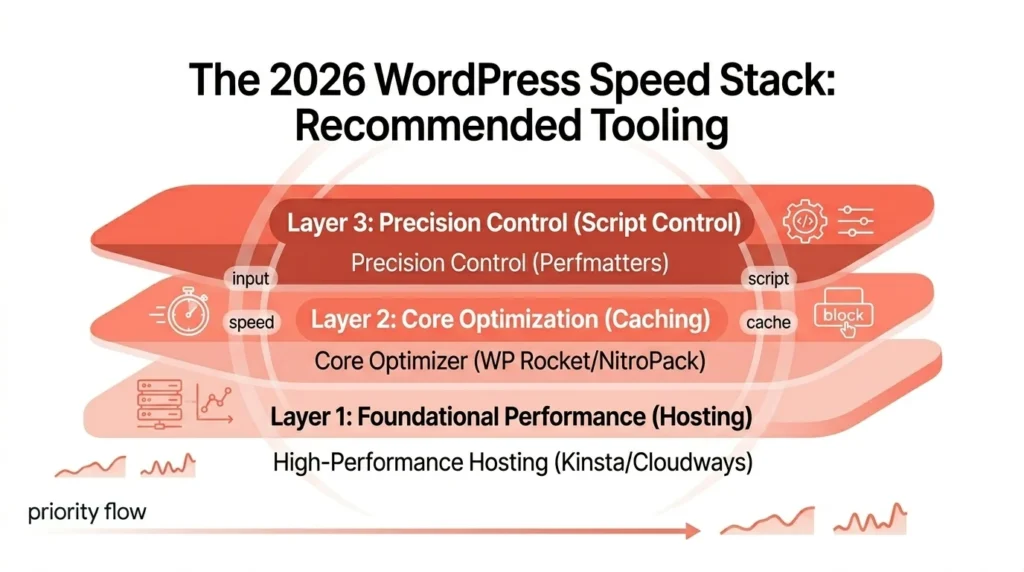
Choosing the right plugin stack is critical. The wrong combination — or too many overlapping plugins — can cause conflicts that actively worsen performance. The right stack handles caching, CSS optimisation, JavaScript deferral, and image delivery in a coordinated way without conflict. Here is the 2026 framework based on real-world test data.
All-in-One Solutions
NitroPack consistently achieves the highest Core Web Vitals pass rates of any optimisation plugin, with an average pass rate of approximately 54% across tested sites. It handles everything: full-page caching, critical CSS, image optimisation, CDN delivery, and JavaScript deferral. It is cloud-based, meaning optimisations happen on their infrastructure before the HTML reaches the browser. The trade-off is cost — it is a paid SaaS product with pricing based on page views.
WP Rocket is the most widely used premium caching plugin and offers the best balance of performance improvement and ease of use. It supports critical CSS, lazy loading, JavaScript deferral, database optimisation, and prefetching. Its ‘Delay JavaScript Execution’ feature is one of the most effective INP optimisation tools available without custom development. For most WordPress sites, WP Rocket is the recommended all-in-one starting point.
Granular Control
Perfmatters is designed to complement a caching plugin rather than replace one. Its strength is per-page script control: you can disable specific scripts and styles on specific pages or post types. If WooCommerce’s cart JavaScript is loading on every blog post — increasing INP and LCP on pages that do not need it — Perfmatters can disable it selectively. This level of control is not available in all-in-one solutions.
Plugin Comparison: CWV Pass Rates and Features
| Plugin | CWV Pass Rate | Critical CSS | JS Delay | Price | Best For |
| NitroPack | ~54% | Yes (cloud) | Yes | From $21/mo | Maximum automation — hands-off optimisation |
| WP Rocket | ~48% | Yes (RUCSS) | Yes | $59/yr | Best all-in-one — balance of features & ease |
| LiteSpeed Cache | ~45% | Yes | Yes | Free | Best free option — requires LiteSpeed server |
| Perfmatters | N/A (complement) | No | Yes | $24.95/yr | Granular per-page script control |
| W3 Total Cache | ~35% | Partial | Partial | Free / $99/yr | High-traffic sites needing server-level config |
Note: CWV pass rates are approximate averages from independent performance research. Results vary significantly based on theme, content, and server configuration.
Diagnostic Tools Every WordPress Owner Should Bookmark
• PageSpeed Insights (pagespeed.web.dev) — Run your URL here first. Shows both lab and field data side by side. Always test on Mobile, not just Desktop.
• Google Search Console — ‘Page Experience’ report shows your real CrUX field data across all pages. This is the data that determines your rankings.
• Chrome DevTools — Performance panel for JavaScript profiling, Lighthouse for synthetic testing, and the Layout Shift Regions tool for CLS diagnosis.
• WebPageTest (webpagetest.org) — Advanced multi-location testing with waterfall charts showing exactly when each resource loads.
• Ahrefs Site Audit — Flags Core Web Vitals failures across your entire site, not just individual pages.
Conclusion
Core Web Vitals is not a checkbox you tick once and forget. Google updates its thresholds, new metrics emerge (INP replaced FID; more changes are likely), and every plugin update, theme change, or new piece of content you add to your site can move your scores. The sites that consistently maintain ‘Good’ CWV status in 2026 are those that have made performance part of their routine workflow, not a one-off project.
Here is the priority order for getting started, based on what delivers the most impact the fastest:
6. Run PageSpeed Insights on your most important pages today. Identify which metric is failing (LCP, INP, or CLS) and by how much.
7. Address server response time first. If TTFB exceeds 600ms, hosting or server-side caching changes are required before front-end work.
8. Fix your LCP element. Remove lazy loading from the hero image. Add a preload hint. Convert to AVIF.
9. Audit your JavaScript. Use Query Monitor and DevTools to identify which scripts are causing long tasks and poor INP. Delay all non-essential third-party scripts.
10. Fix CLS sources. Add dimensions to all images. Self-host fonts with font-display: swap. Reserve space for ads and dynamic elements.
11. Install a performance plugin appropriate for your budget and technical comfort. WP Rocket is the recommended starting point.
12. Set a monthly reminder to re-check PageSpeed Insights and Google Search Console’s Page Experience report.The business case for this work is compelling. Research from Google and multiple e-commerce studies consistently shows that every 1 second improvement in LCP correlates with up to a 20% increase in conversion rates. A faster site does not just rank better — it converts better, retains visitors longer, and reduces bounce rates. For an e-commerce site processing 500 orders a month, a 20% conversion rate improvement is not an SEO metric. It is a revenue number.